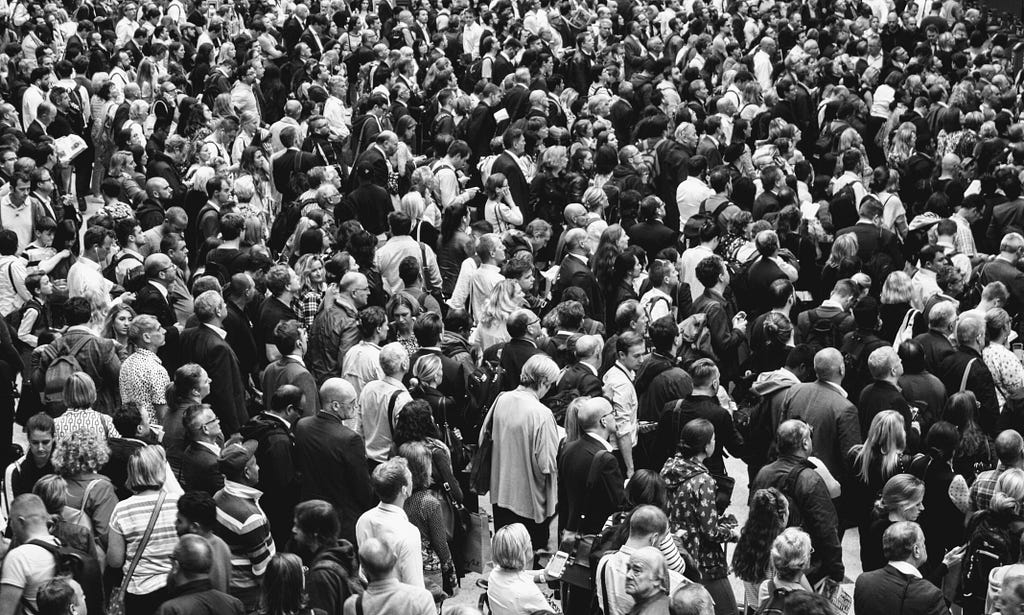
The global refugee crisis, driven by factors such as economic instability, sociopolitical unrest, war, violence, and natural disasters, has led to unprecedented levels of forced displacement. Many host countries, often low-income nations according to the World Development Indicators (WDI), face immense challenges as they strive to accommodate refugees.
As The World Bank notes, “Host communities need support, too. The forcibly displaced often live in poor areas in developing countries that are struggling to meet their own development goals. Accommodating the sudden arrival of masses of newcomers presents a challenge for host governments, putting further pressure on their ability to deliver basic services and infrastructure.”
Understanding the complex dynamics of both displaced populations and the challenges faced by host nations is crucial for addressing this global crisis effectively.
Source
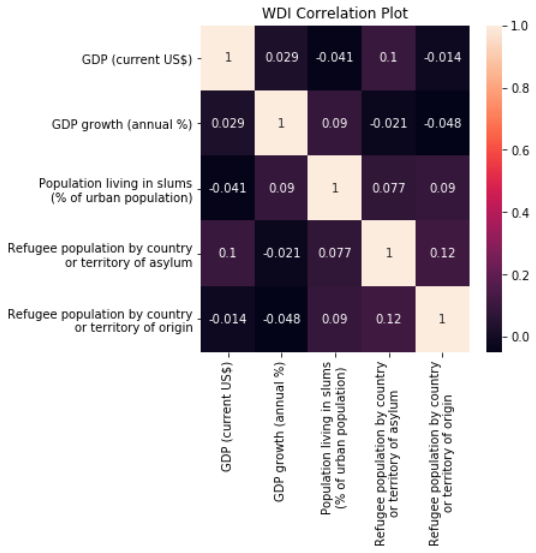
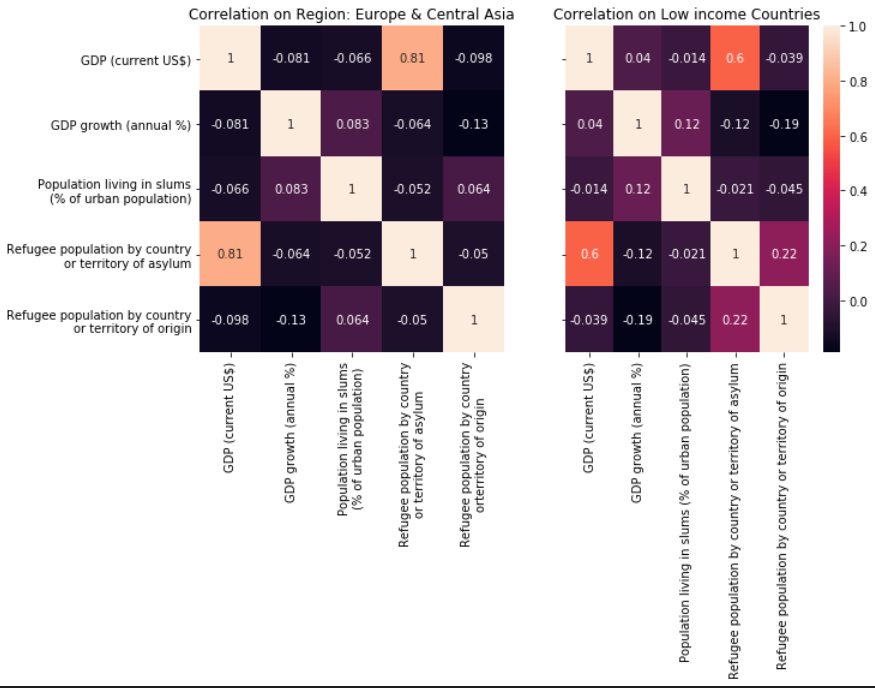
Interestingly, when focusing on low-income countries or the ‘Europe & Central Asia’ region, we observe a higher correlation between “GDP (current US$)” and the refugee population by country or territory of asylum. This aligns with the intuition that larger economies, as measured by GDP, have a greater capacity to host refugees. However, even among low-income countries, there is a strong correlation between GDP and refugee populations. This suggests that higher GDP, even within the lower income bracket, may play a role in hosting refugees. In the next iteration of this report, I plan to label-encode income classes and one-hot encode regions before applying Pearson correlation for deeper insights.
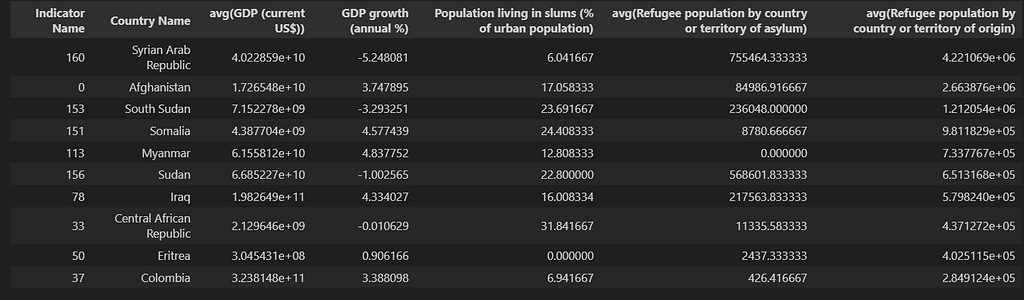
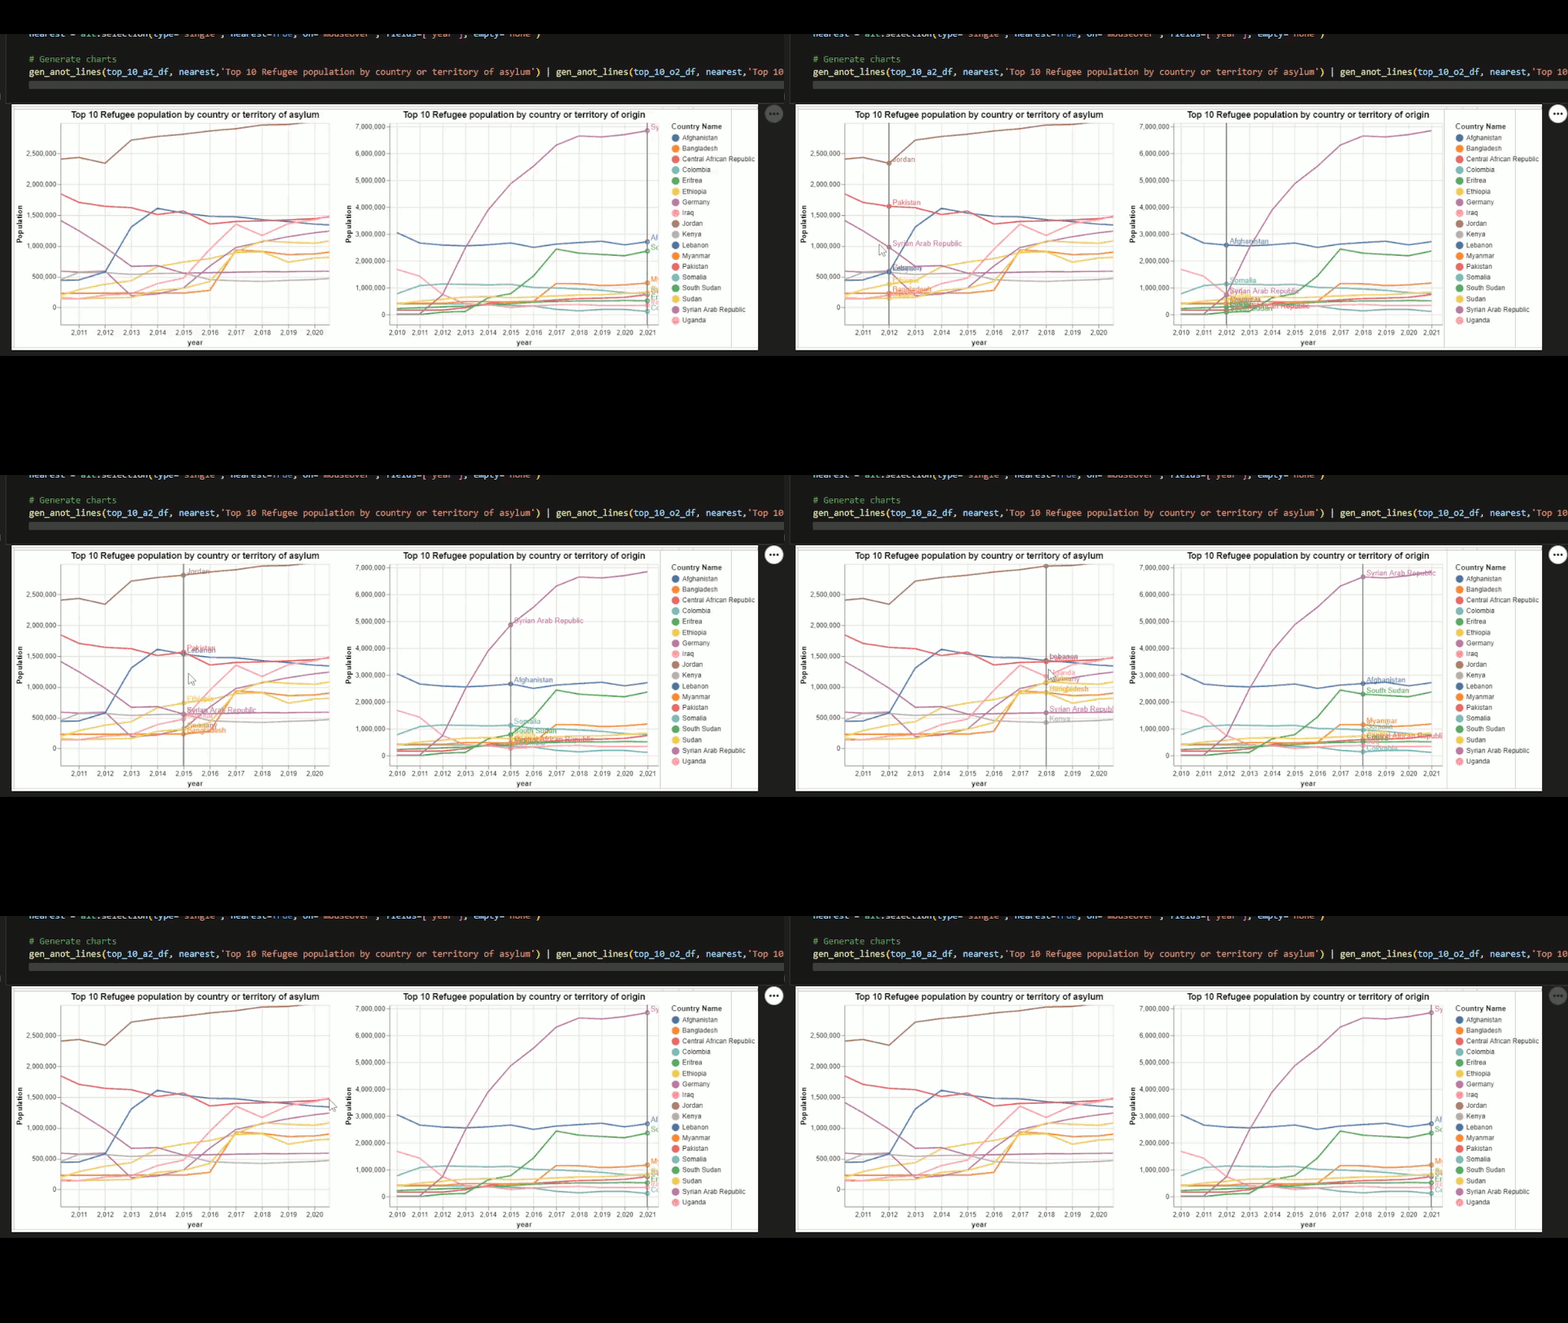
To narrow the scope, I will focus on the top 10 countries where refugees seek asylum and the main countries from which they are fleeing. Based on the data, Jordan, Pakistan, and Lebanon rank as the top three countries hosting refugees from other nations.
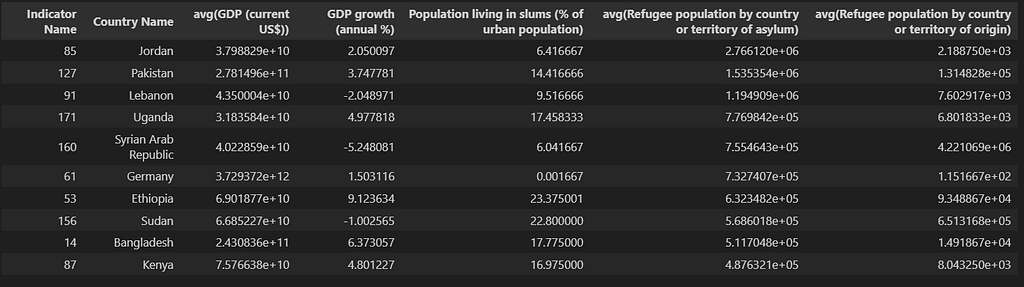
Alternatively, I aimed to investigate the countries producing refugees to better understand the underlying factors, such as economic hardship or political instability. The findings align with expectations based on international headlines, such as Syria’s ongoing civil war and the political upheaval in Afghanistan following its government transition.
Encoded by year as a position, value of indicator as position, and Income Group by Color.
I wanted to explore Refugee and Asylum trends using Income Group defined by the WDI and as expected the low income countries produce the most refugees.
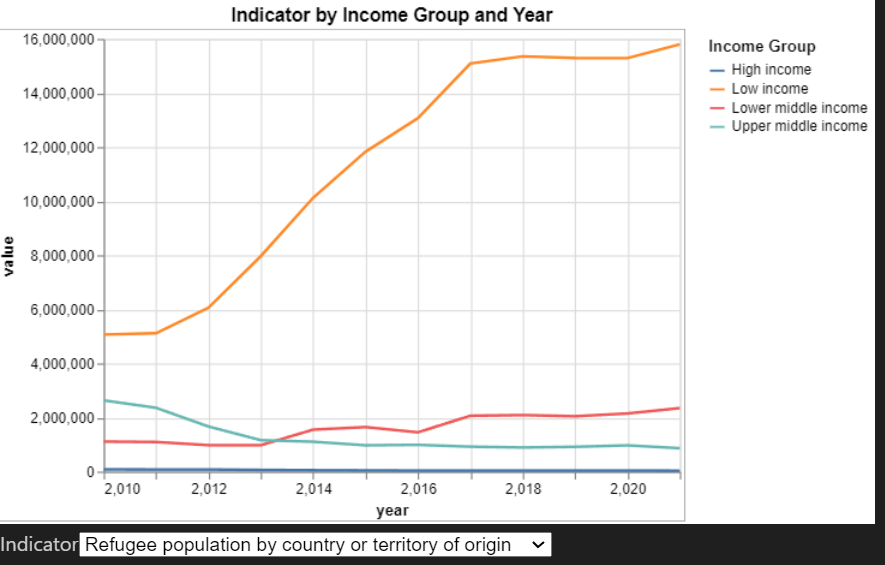
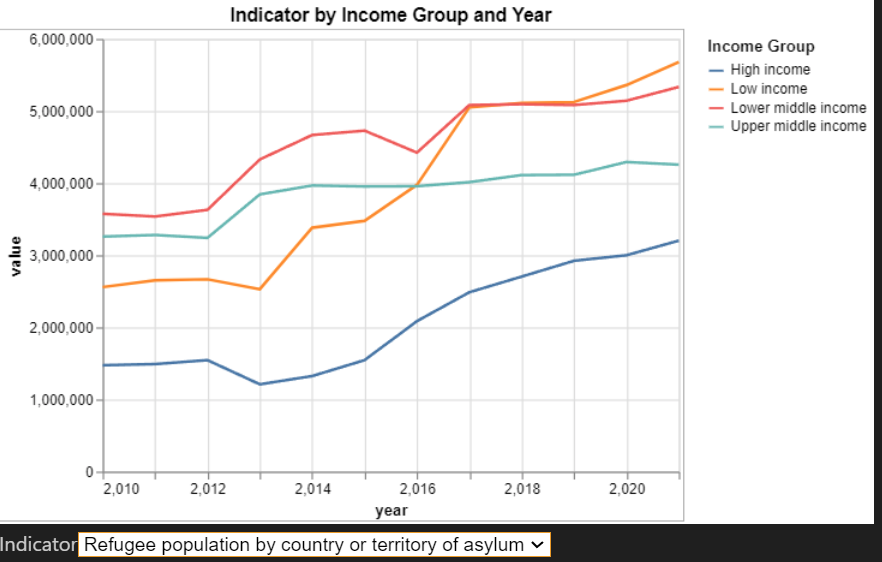
In the chart, refugee population increases among all income groups, but ‘Low Income’ countries bear the brunt
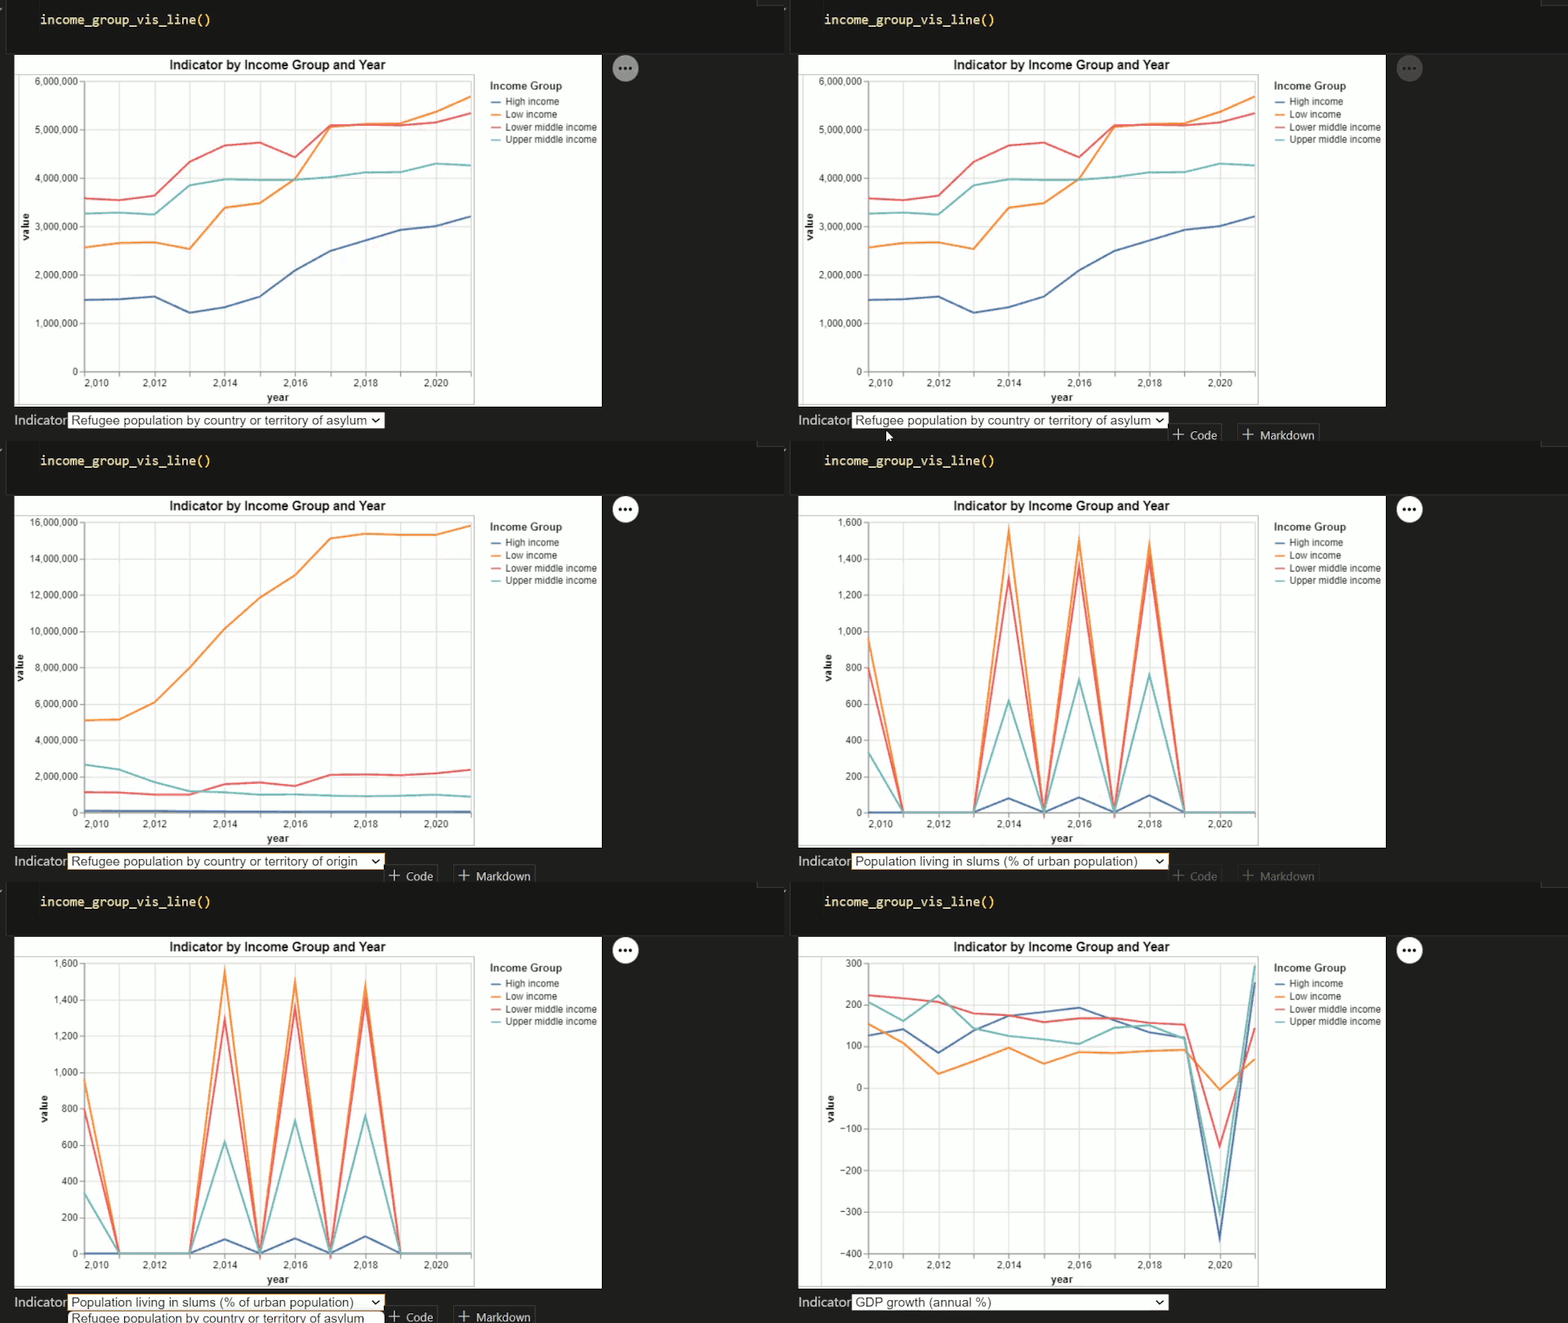
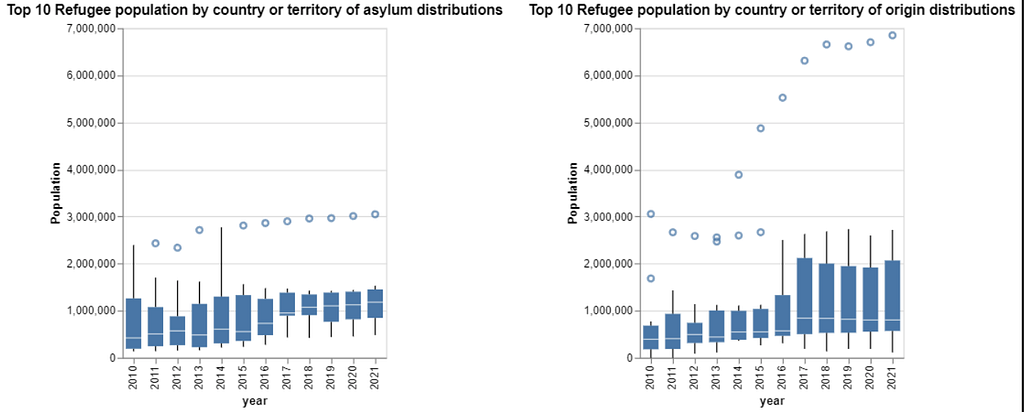
The distributions of both “Refugee population by country or territory of asylum” and “Refugee population by country or territory of origin” exhibit a strong right skew with notable outliers, indicating that they are not normally distributed. Over time, the spread of “Refugee population by country or territory of asylum” tends to decrease, while the “Refugee population by country or territory of origin” shows an increasing trend. Although we considered using distribution plots and histograms, they were ultimately not chosen due to the temporal dimension of the data.
Interestingly, Germany have been accepting a lot of refugees this past decade. Interactivity is enabled to hover points by year.
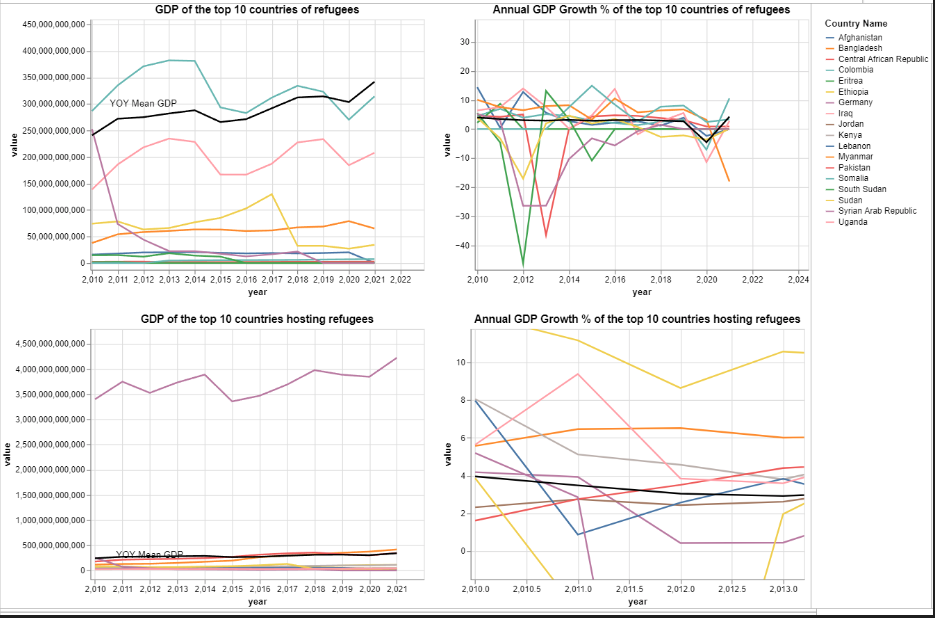
As expected countries where refugees originate have a negative GDP and therefore, economy is shrinking. These countries also have GDP less than the average country GDP of that year.
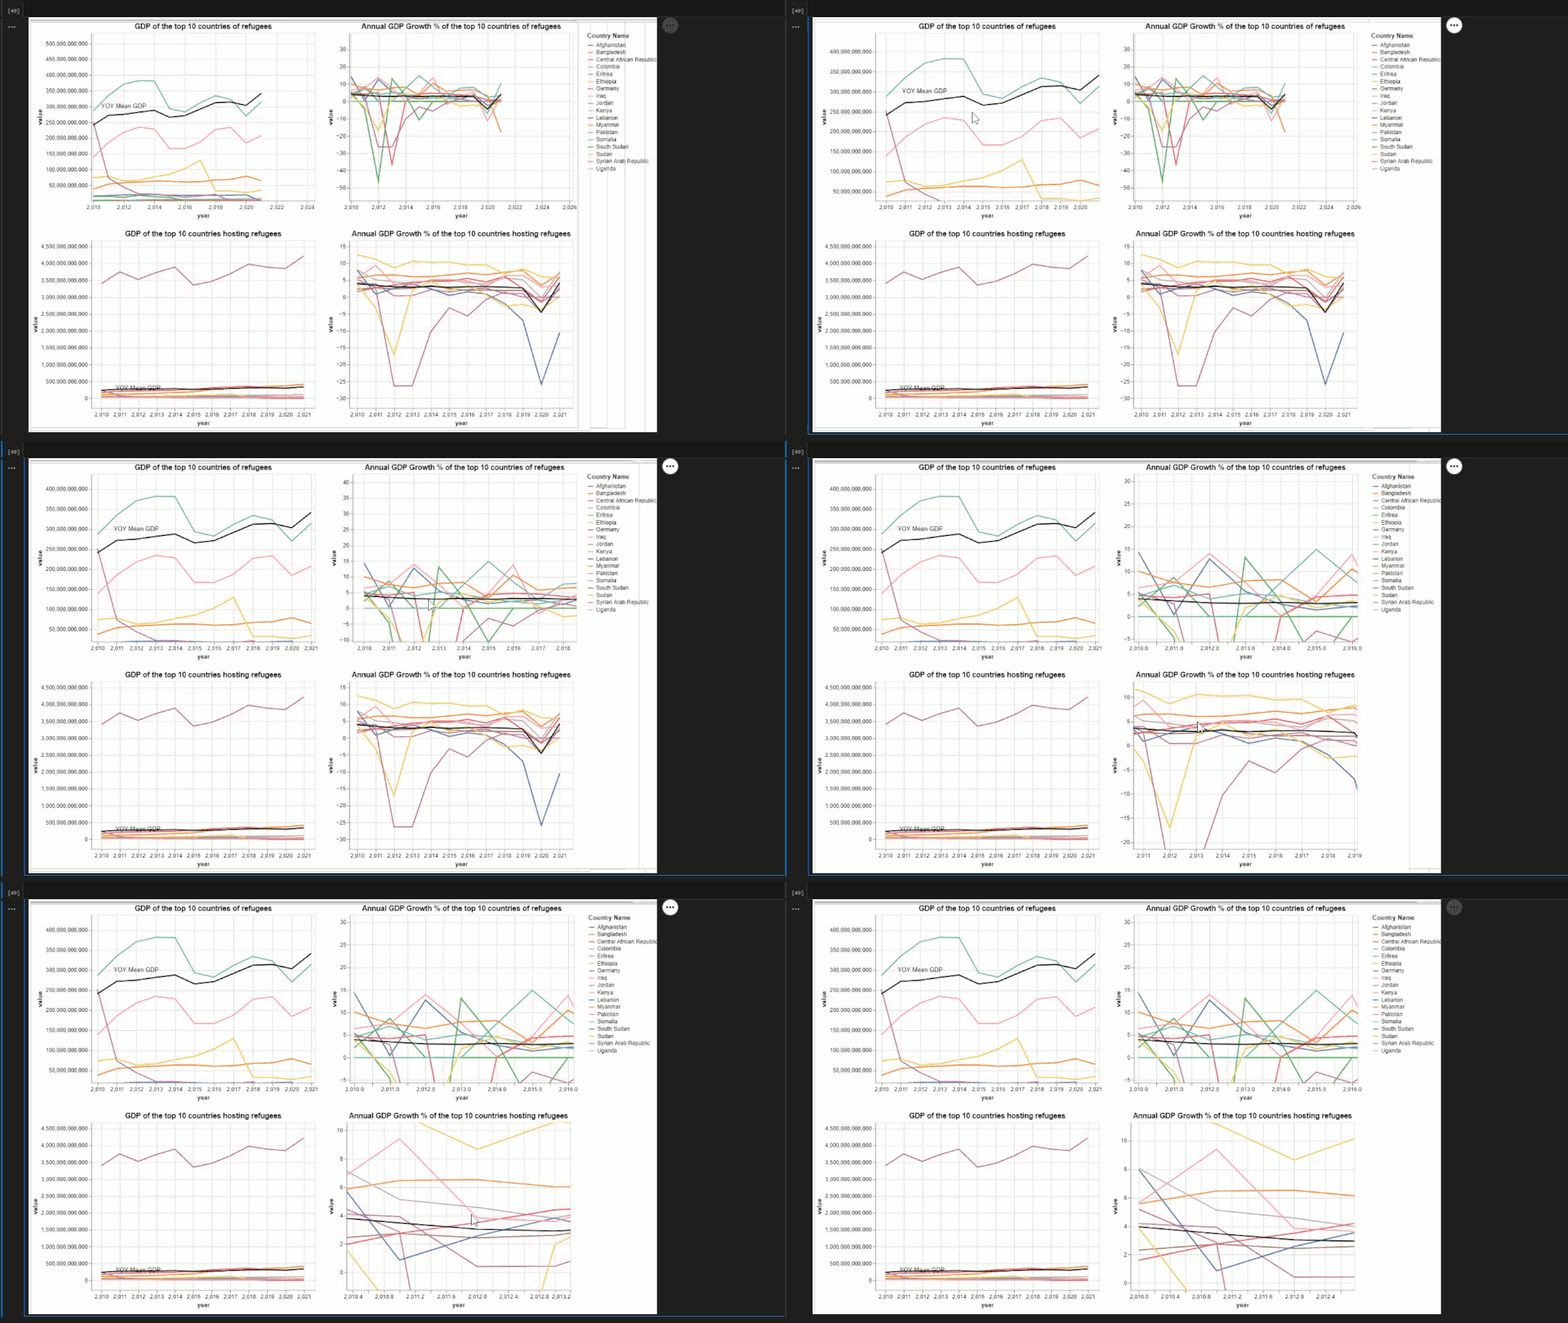
Recommendation: There is a critical need for investment from higher-income countries into lower-income nations to support their capacity to host refugees and mitigate the economic strain.
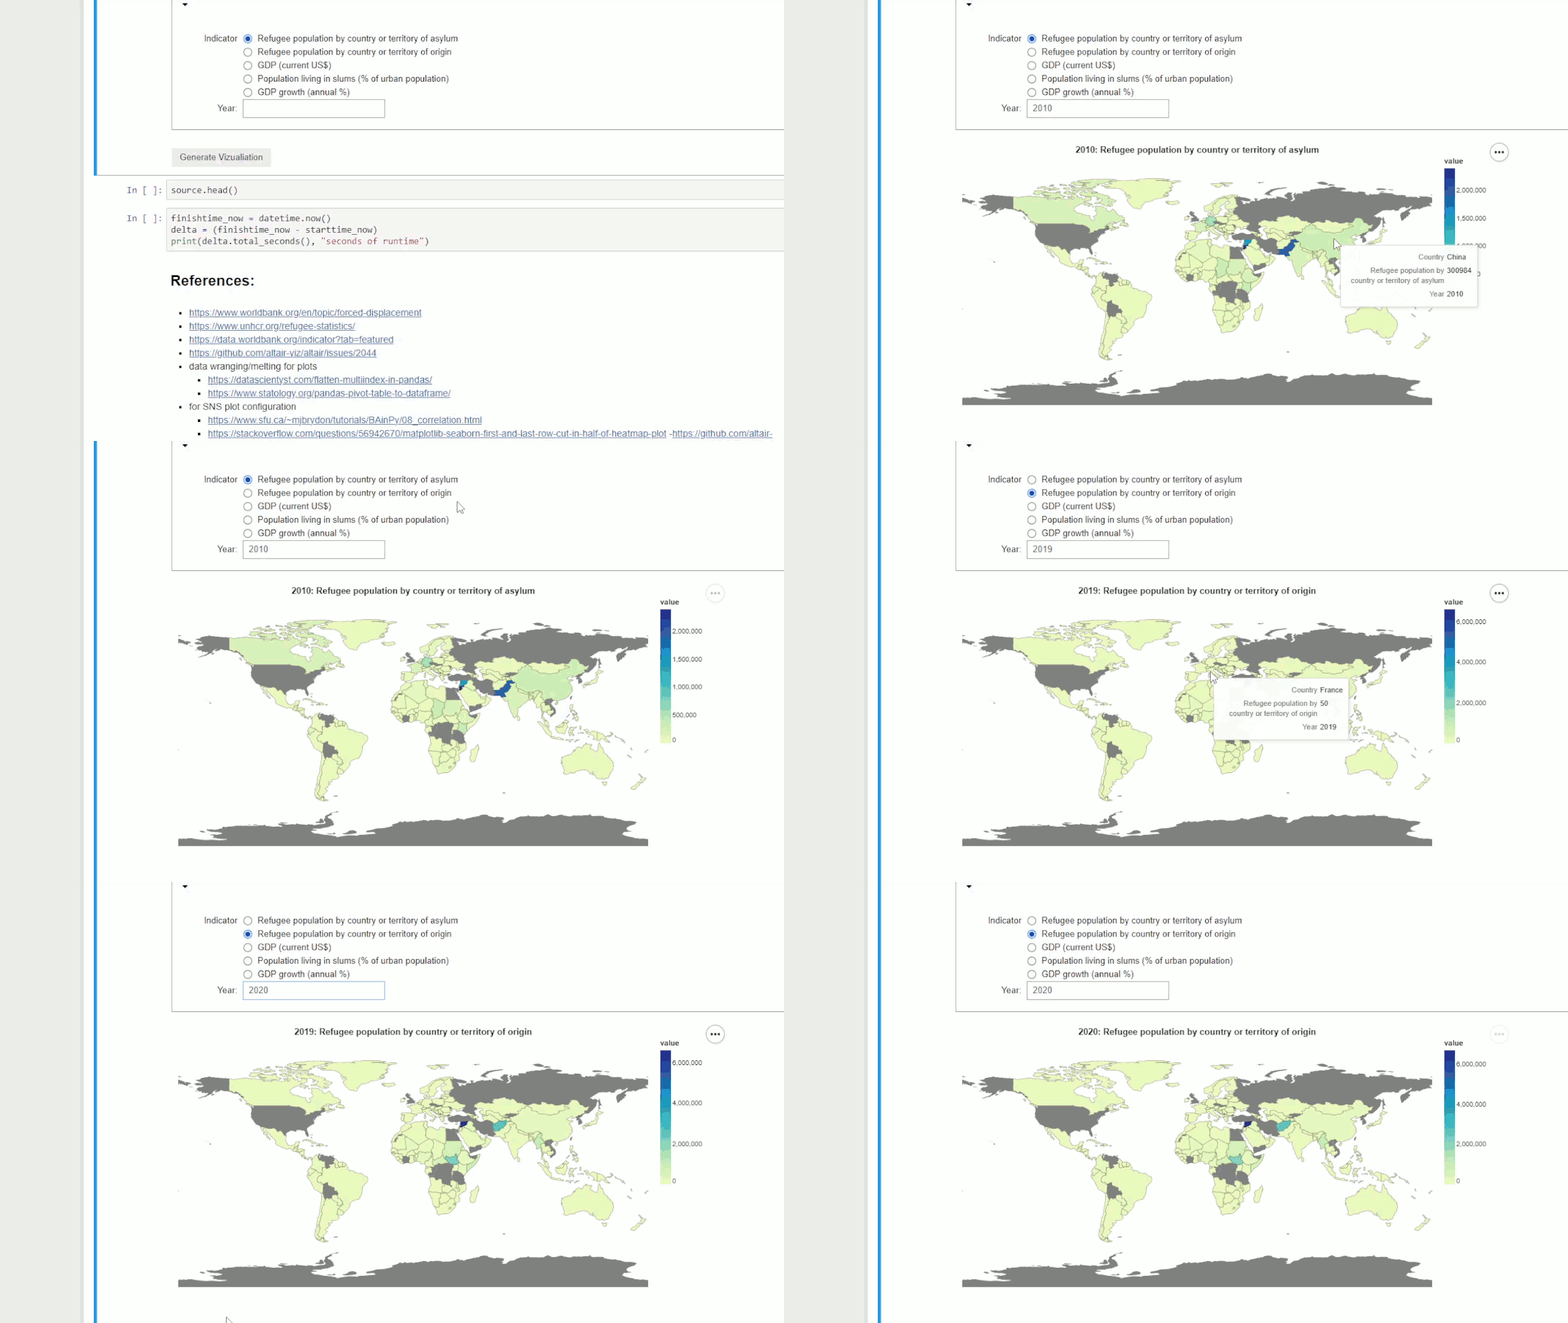
An interactive map built using Vega and Altair where the parameters are the year and interested Indicator reported by the World Bank.
4. Special thanks to GIMP and OBS for enabling the creation of web assets for this publication. Both tools offer powerful video capture and photo editing capabilities, and they are free and open-source!