NBA Graphs - 2015 Playoffs with R studio
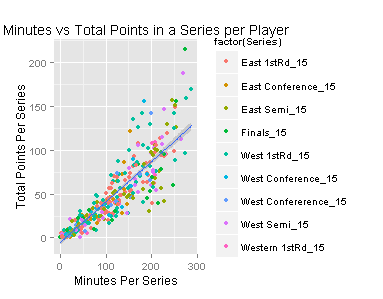
Using the CSV exported from a previous project using SQL, I continued to make more sophisticated graphs using ggplot with R studio. The information presented represents real data of players that participated in the 2015 NBA Playoffs. Again, I used basketball-reference.com to procure the raw data.
Here are the results:
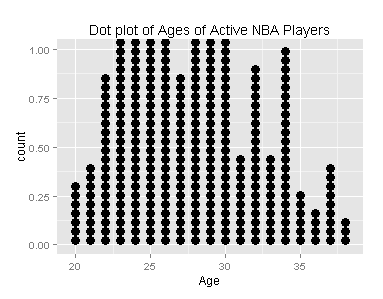
![SummmaryStatistics] (https://raw.githubusercontent.com/godot107/godot107.github.io/refs/heads/main/assets/img/nba_Age Summary.JPG)
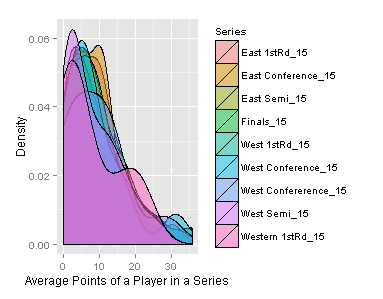
Density Graph using Average Assists, Rebounds, and Points
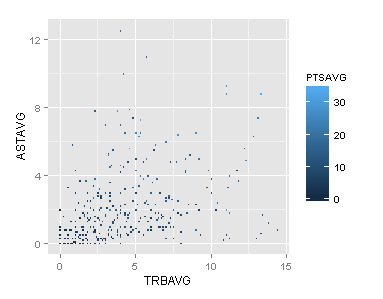
Density Graph using Average Assists, Rebounds, and Points
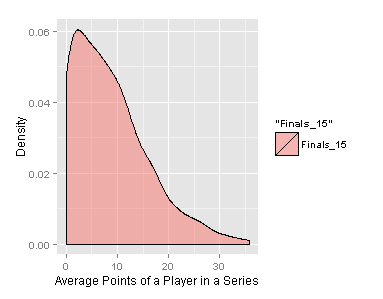
Density Graph of Average Points of a Player in the NBA 2015 Finals
Includes: R code, Original Data, and Copy of Graphs
Looking ahead: I will continue to plot more advanced graphs. In addition, I want to feature more interaction with graphs where one could run the R code and interact with plots to expand with more detailed information. Another possible interaction may include a search feature of some sort that accepts user input. A simple means of that is to incorporate functions in the R code first.
Enjoy Reading This Article?
Here are some more articles you might like to read next: